Unihiker K10 Lesson 4
Introduction:
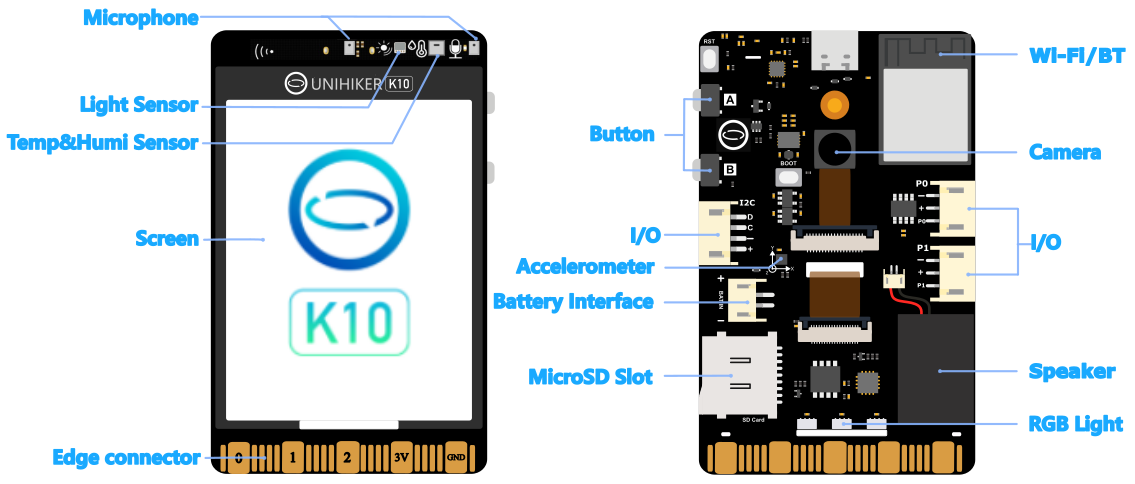
The UNIHIKER K10 is equipped with a variety of onboard sensors including temperature, humidity, light, and an accelerometer. These sensors make the K10 perfect for building real-time data monitoring systems. In this lesson, you will create a digital dashboard using MicroPython that displays live sensor values directly on the screen. This kind of project is useful for environmental monitoring, physical computing education, and prototype development in IoT.
What You’ll Learn:
- How to access onboard sensors via MicroPython
- How to read temperature, humidity, light intensity, and acceleration data
- How to display updated sensor values on the screen in real time
Sensor Classes Used:
TempHumSensor()– Reads temperature and humidityLightSensor()– Reads light levelAccelerometer()– Reads X, Y, Z acceleration data
Step-by-Step Code:
pythonCopyEditfrom pinpong.board import Board
from pinpong.libs.unihiker import GUI, TempHumSensor, LightSensor, Accelerometer
import time

# Initialize board and devices
Board().begin()
screen = GUI()
temp_humi = TempHumSensor()
light = LightSensor()
acce = Accelerometer()

# Main loop
while True:
    temp, humi = temp_humi.read()
    light_val = light.read()
    acc = acce.read()

    # Clear and update display
    screen.clear()
    screen.draw_string(10, 10, "Sensor Dashboard", scale=2)
    screen.draw_string(10, 50, f"Temp: {temp:.1f} C")
    screen.draw_string(10, 80, f"Humidity: {humi:.1f}%")
    screen.draw_string(10, 110, f"Light: {light_val}")
    screen.draw_string(10, 140, f"Accel: X={acc['x']:.2f} Y={acc['y']:.2f} Z={acc['z']:.2f}")

    time.sleep(1)  # Update every second
Explanation:
temp_humi.read()returns a tuple with temperature and humidity values.light.read()returns the ambient light level.acce.read()returns a dictionary containingx,y, andzacceleration values.
This loop continuously refreshes the screen with new readings. The screen.clear() function ensures only the latest data is displayed, avoiding overlap or ghosting.
Tips for Extension:
- Add color indicators: change background or text color if certain thresholds are exceeded (e.g., too hot or too dark).
- Log data to a file or SD card.
- Send data to a remote server or cloud dashboard (covered in Lesson 5).
Conclusion:
You now have a functioning sensor dashboard that reads and displays real-world environmental data. This setup can be further expanded to include alerts, data logging, and IoT connectivity. It’s a great foundation for students and developers who want to understand how real-world sensing and display integration works in MicroPython. In the next lesson, you’ll integrate the K10’s camera module to explore visual inputs and AI face detection.